Saturday 12 March 2011
Wednesday 15 December 2010
What if ...Self evaluation
‘There is so much unused space in Leeds. What do the public want from it’ was the problem our group identified. This problem arose as a result of our research into unused spaces in Leeds. Prior to collecting our primary qualitative data, we used Google Maps to view these areas:
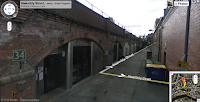
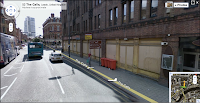


We then carried out primary research to identify and document these areas primarily using photography.


We used the internet to research into this empty space on the internet which resulted in some intriguing discoveries.


These websites demonstrate how current our problem is and the extent to which the public are concerned with the issue in hand.
We also took a trip down to the area we were focusing on and carried primary quantitative data, as we realised this is an area of research we were lacking. We spent 30 minutes recording various data, this is what we found in the the time that we were there.
We asked members of the public to fill in our interactive posters:


A table recording how many people passed by the area on a Tuesday lunch time,
Men | Women | ||
18-29 | 51 | 18-29 | 30 |
30-50 | 28 | 30-50 | 21 |
50+ | 21 | 50+ | 12 |
3:2 Ratio of men to women walking past
Occupied buildings – 13
Unoccupied buildings – 9
41% Unoccupied
Between 12:40 and 12:50 – 48 cars drove past.
All available roadside parking was limited and expensive, one way street.
This is a table summarising the our data we collected:
Primary Research | Secondary Research |
Qualitative | Qualitative |
|
|
Quantitative | Quantitative |
|
|
The map pinpointing the 92 empty shops in Leeds was useful as it gave us an area in Leeds to focus our research upon. I also found the photographs we took particularly useful, as they ensured our problem was current; allowing us to see the full extent to which our problem was existing. Our interactive posters and surveys were also very useful as this gave us knowledge that we had identified a live problem in the public domain and were able to gain true feedback from the people concerned.
Nevertheless, once we had begun to collect data for analysis we soon found that we were lacking primary quantitative data. Therefore, we took the time to collect this data by surveying various characteristics on our chosen street in Leeds; ‘The Calls.’ However, once we had collected this data we found that is was predominantly primary qualitative data so had to set about converting it into quantitative data.
To improve our research we could have researched into what the building we were primarily focusing on was prior to its degeneration; we could have also attempted to discover who owned the building and why it closed down. Knowledge of this information could have resulted in us taking this project further in relation to a more directed final resolution.
Over the last two weeks, I have learnt:
- Not considering the end product at the beginning of a brief can sometimes result in innovative outcome.
- Research is immensely important in the design process and should not be overlooked.
- Research should be meaningful to the brief in hand.
- It is best to have a variety of research; primary, secondary, quantitative and qualitative.
- Keeping the design simple but having a strong concept can often produce effective results.
Next time I would:
- Ensure I collect a range of data from a range of sources.
- Collect a sufficient amount of quantitative data.
- Put more of my ideas forward to the group.
- Take more of an assertive role within the group.
- Produce more designs for the groups consideration.
Monday 22 November 2010
End of Module Self-Evaluation.
WHAT SKILLS HAVE YOU DEVELOPED THROUGH THIS MODULE AND HOW EFFECTIVELY DO YOU THINK YOU HAVE APPLIED THEM?
I have learnt how to use the basics of Illustrator, however, only used this on my illustrator brief. I have also gained a deeper understanding of colour theory but have not yet had a chance to incorporate these concepts into my designs. I now see graphics everywhere I go and am constantly critically analysing it!
I have also learnt the necessity of time management and how important it is in ensuring i have the ability to work at my best. One major concept i have grasped through the completion of this module is that less can sometimes be more; it is not necessary fill a page and that it can often have a higher impact by just simply presenting the most important facts and nothing else.
WHAT APPROACHES TO/METHODS OF RESEARCH HAVE YOU DEVELOPED AND HOW HAVE THEY INFORMED YOUR DESIGN DEVELOPMENT PROCESS?
I have begun to present my research on designs sheets and realised that it is so much more about the content on the page rather than the appearance. This was a hard concept for me grasp at first as I have always been particular about the presentation of my research. This has enabled me to use my research constructively to aid my work; as it is freely available, concise and relevant to the work in hand.
WHAT STRENGTHS CAN YOU IDENTIFY IN YOUR WORK AND HOW HAVE/WILL YOU CAPITALISE ON THESE?
I document my ideas and the process leading up to my final resolution considerably well, as i like my final resolution to have reasoning behind it.
WHAT WEAKNESSES CAN YOU IDENTIFY IN YOUR WORK AND HOW WILL YOU ADDRESS THESE MORE FULLY?
My use of illustrator is not great so i will try and use it more where applicable. My blog is not as aesthetically pleasing as it could be and a little under documented in places, so this is something i could work on improving. I also need to get into the habit of checking moodle and my college email on a daily basis; I do check these on a regular basis but not daily.
IDENTIFY FIVE THINGS THAT YOU WILL DO DIFFERENTLY NEXT TIME AND WHAT DO YOU EXPECT TO GAIN FROM DOING THESE?
1- Blogging: I will keep my blog up to date and organised.
2- Read the brief in it's entirety to ensure i am adhering to it fully.
3- CTS: ensure I keep up to date with blogging my lecture notes.
4- Push myself to produce work out of my comfort zone.
5- Use Illustrator more.
ATTENDANCE 5
PUNCTUALITY 4
MOTIVATION 4
COMMITMENT 4
QUANTITY OF WORK PRODUCED 4
QUALITY OF WORK PRODUCED 3
CONTRIBUTION TO THE GROUP 2
Sunday 21 November 2010
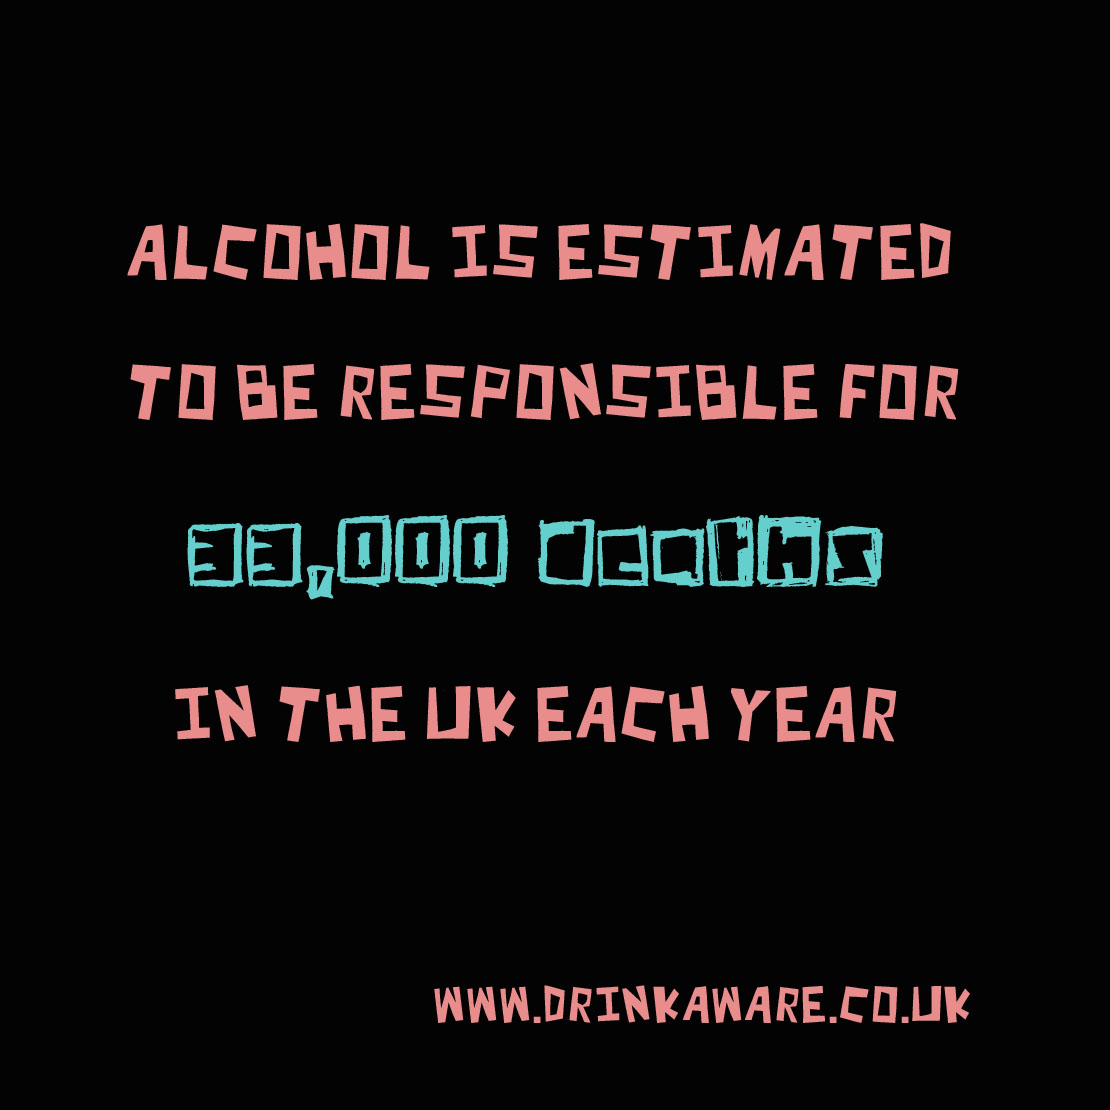
No New is Good News. Message & Delivery. Self Evaluation.
What is being communicated and how?
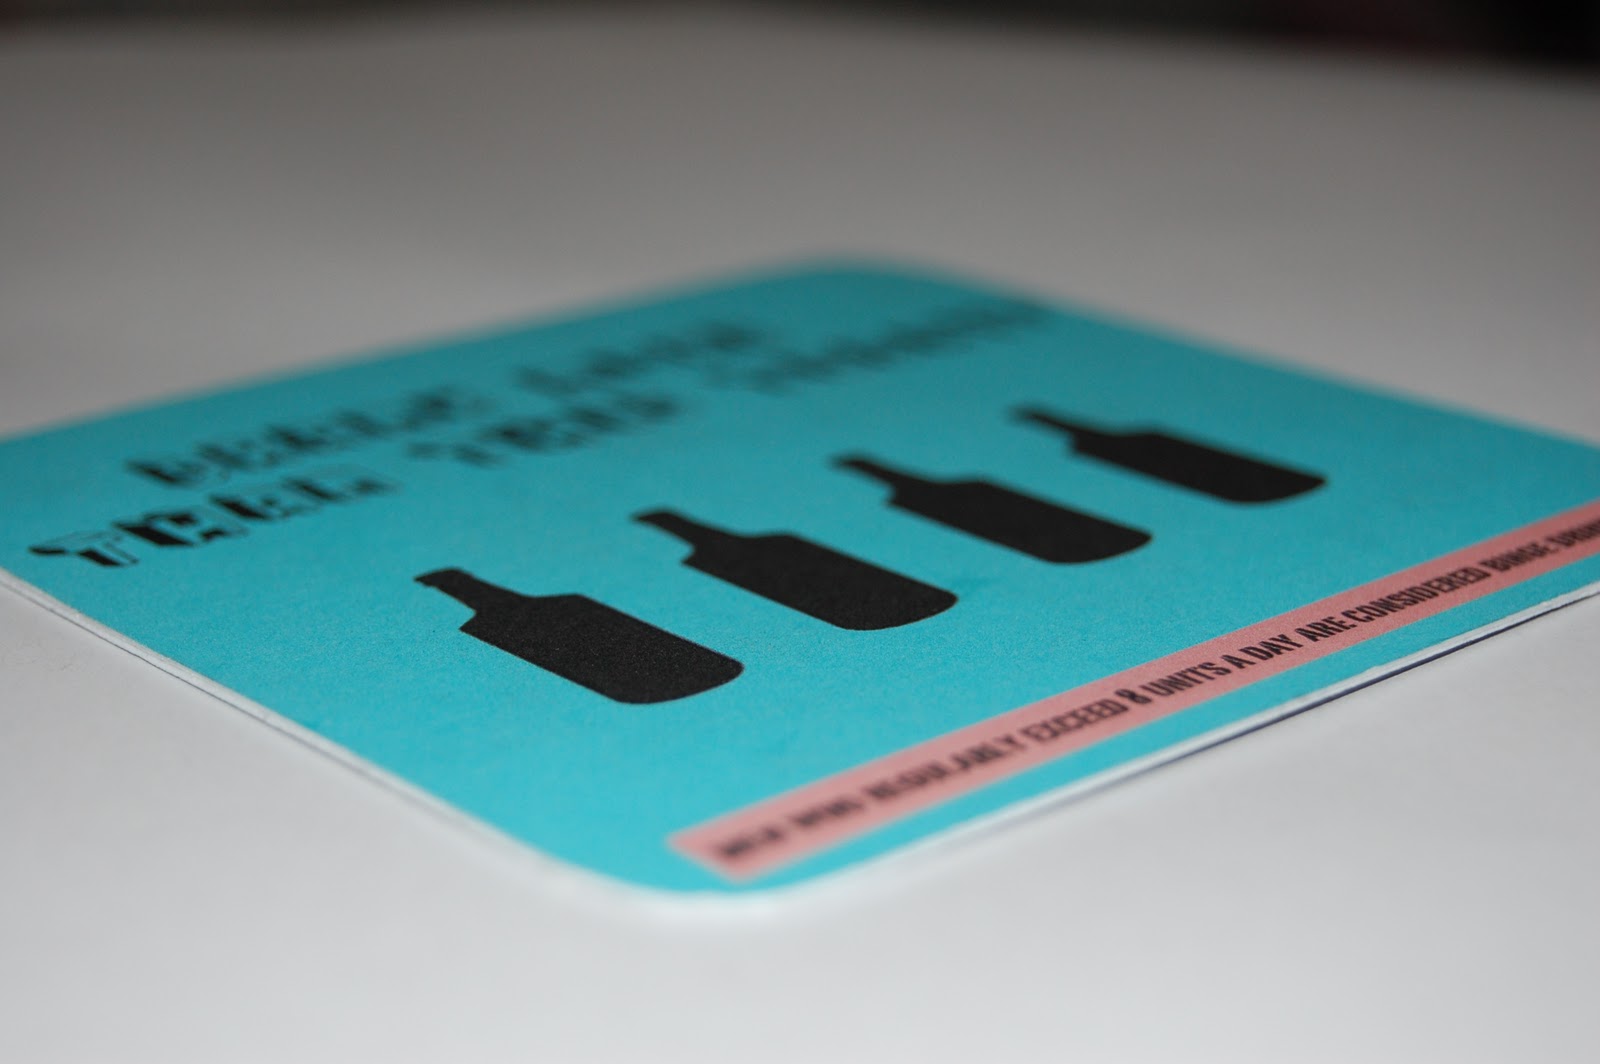
Raising awareness of the daily consumption of alcohol guidelines for males and females.
How well does it answer the brief? Why?
My resolution does not fit mandatory requirements fully as it uses 3 colours plus stock instead of two. However, the content fits the brief as it reinforcing my message to an appropriate list of recipients and one mail shot was delivered by post to college.
Who is the audience and how well does the resolution communicate its message/content to them?
Young drinkers, students and regular pub goers.
I have tried to keep the beermats simple, concise and to the point in order for the emphasis to be on the message posed.
What are the strengths of the resolution? (refer to whole body of work)
Although the colour scheme does fit the brief, I think the colours work well together and flow across the whole body of work.
How could it be improved?
Use 2 colours plus stock.
Create a more masculine envelope.
General Comments.
I have learnt a fair bit from this project .....the most important being READ THE BRIEF FULLY!!!


Subscribe to:
Posts (Atom)